Posted June 14, 2023
In this blog post, we will discuss what I think is a hidden pandemic: insulin resistance.
Insulin is a hormone that is central to the regulation of blood sugar levels, and insulin resistance is a condition in which the body is, more or less, resistant to the effects of insulin. Insulin resistance does not just affect people with type 2 diabetes, but is quite common in the non-diabetic portion of the population as well.
In the three most recent blog posts, we talked about blood sugar spikes, and I shared several strategies on how we can avoid them. Several of you commented that blood sugar is not the only biomarker we should be looking at when we eat carbs. Because even if we avoid a blood sugar spike, we may still experience an insulin spike, and not even know about it.
That is correct because we cannot necessarily know from our blood sugar levels what our blood insulin levels look like. Even if we don’t have diabetes, if we are insulin resistant, we may constantly have very high insulin levels in blood. And, as we will see in this new series on insulin resistance we are starting with this blog post, being insulin resistant and having high insulin levels in the blood is not ideal.
At the end of this blog post, you will understand why you may want to know whether you are insulin resistant, and you will be able to have a discussion with your doctor about the type of test you want to have done to measure insulin resistance. I will also share how to correctly interpret these lab results so that you can draw the correct conclusions from the test.
The Relationship Between Blood Glucose and Blood Insulin Levels
Let’s first review the relationship between blood glucose and blood insulin levels. This was covered in detail in my blog post on the regulation of blood sugar.
In that blog post, we talked about two men, Ben and Jack. Both undergo an oral glucose tolerance test, during which they drink a beverage containing 75g of glucose. Both are healthy, with good glucose tolerance, and they have almost identical blood sugar responses. So from these two curves, you would think that all is well and neither of them has any issues with their blood sugar regulation.

This is an incorrect assumption, however.
And that becomes clear when we look at their blood insulin levels. Jack has very low insulin in the fasting state, and barely a bump during the test. He is very insulin sensitive and his body requires very little insulin to keep his blood sugar in the normal range.

Ben, by contrast, is very insulin resistant. That’s already apparent in the fasting state, with much higher fasting insulin levels. But then, upon drinking the 75g glucose beverage, his insulin levels shoot up like a rocket. Because his tissues are resistant to the effects of insulin, he needs much higher concentrations of insulin to clear the sugar from the blood after a meal.
Or, let’s look at someone else. Linda here. She has obesity, but according to her doctor, her fasting glucose and HbA1c are fine and she does not have diabetes. Just out of interest, she purchases a continuous glucose monitor, to keep an eye on her blood sugar level. One morning, she has her typical breakfast of two slices of toast with some butter and jam. And then, she watches as her blood sugar spikes to over 200 mg/dL, stays elevated for a little bit, and then drops down again.
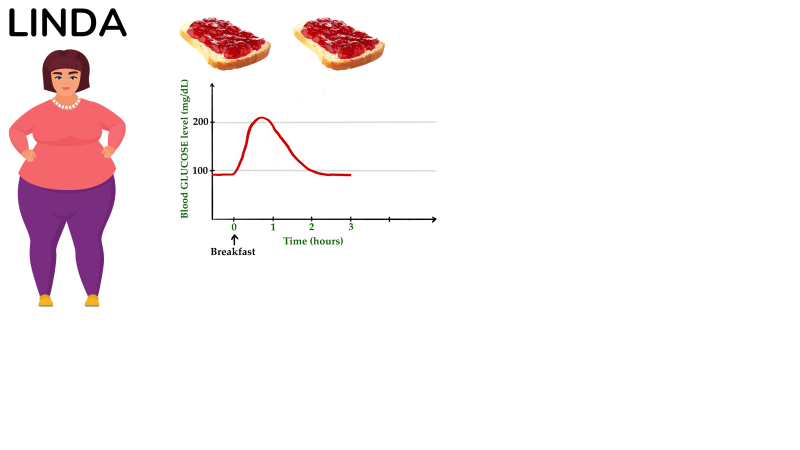
Now she is worried, and all ears as her hairdresser tells her about this fantastic video about how to avoid blood sugar spikes on YouTube. She watches it, and, the next morning, makes a few changes to her breakfast. She now has a lower-glycemic index bread, with some cheese, some pickles, and a couple of boiled eggs. And, low and behold, this stuff works. Now her blood sugar level rises only to 155 mg/dL, which the dude in the video says doesn’t constitute a spike. Great!

Well, is it great? I’d say it is better than before because, all other things being equal, avoiding a blood sugar spike is a good thing. But what if we now looked at her insulin levels? We discussed in the last two blog posts that in some people, blood sugar spikes can be the result of a reduced first-phase insulin response. However, that’s not the case for Linda. She, it turns out, is insulin resistant, and her body makes a lot of insulin whenever she eats carbs to handle the incoming glucose. So when she eats a high-carb meal, her blood insulin levels rise a lot, similar to what we saw earlier with Ben. And while avoiding a blood sugar spike would also reduce the requirements for insulin, see how insulin levels are lower on day 2 in the figure below, the blood insulin concentrations are still quite high if we compare them to someone who is insulin sensitive, like Jack in our earlier example.

Now, is that even a concern? Isn’t it great that her body can make this much insulin and keep her from developing diabetes? Yes, that aspect is good. Definitely better not to have diabetes. But, again, all other things being equal, it would be preferable to be more insulin sensitive and not have such high insulin levels.
That brings us to the next point:
Insulin Resistance Is a Risk Factor For Type 2 Diabetes
In our previous blog post on the regulation of blood sugar, we discussed the relationship between insulin sensitivity, shown here on the x-axis, and the amount of insulin produced by the beta-cells in the pancreas, shown on the y-axis. Jack’s insulin sensitivity is high, and the amount of insulin produced by his beta-cells is low. Now, a very important point: this is not to say that Jack’s beta-cells could not produce more insulin, they just don’t have to, because he is so insulin sensitive. Ben, by comparison, is very insulin resistant (meaning he has low insulin sensitivity), and as a result, his beta-cells need to produce a lot more insulin. As we saw, he is still able to keep his blood sugar levels within the normal range by producing way more insulin than Jack.

If we studied the relationship between insulin sensitivity and the amount of insulin produced by the pancreatic beta-cell in a large group of healthy people with normal glucose tolerance, we would get a cloud like the one shown in the figure below. Some of these people are very insulin sensitive, like Jack, some are very insulin resistant, like Ben, and most are somewhere in the middle. What they all have in common is that their beta-cells can produce enough insulin for their given level of insulin resistance.

Let’s plot someone with type 2 diabetes on this graph, Fred. He is as insulin resistant as Ben, but his beta-cells just cannot produce enough insulin to make up for that level of insulin resistance. He, therefore, is unable to clear sugar from his blood effectively, and he has type 2 diabetes. So what this means is that Fred’s beta-cells cannot produce more insulin than than is indicated by the green line.

And this is the key point to understand here: everyone has a certain maximum amount of insulin they can produce. Where exactly that level is seems to depend to a large degree on genetic factors, but there is also evidence that this can change in our lifetime and that we can influence the ability of our beta-cells to produce insulin, to some degree.
So if we look at Jack again, he is perfectly glucose tolerant at this point, but if he were to become insulin resistant for some reason, we don’t know whether his beta-cells would be able to produce more insulin. If his maximum beta-cell output were just above his current level of insulin production (see figure below in the left), he would become pre-diabetic or even diabetic if he became just a bit more insulin resistant, or at least, his glucose tolerance would immediately get worse. If his maximum beta-cell output were quite high (illustrated in the figure below on the right), then he could possibly become quite insulin resistant but still have good glucose tolerance, because his pancreatic beta-cells could compensate for the insulin resistance by producing a lot more insulin.
The problem is that for any given person, we typically don’t know the maximal beta-cell output level (until they develop diabetes). I would therefore argue that – all other things being equal – it’s clearly preferable to be more insulin sensitive. Whatever your maximum beta-cell insulin production capacity is, you’re less likely to need more insulin than your beta-cells can produce if you are more insulin sensitive.
And this theoretical consideration is also reflected in data from cohort studies, in which insulin resistance in healthy people is a risk factor for the development of type 2 diabetes and a risk factor for worsening glucose tolerance in patients with type 2 diabetes.
I hope this makes sense. If it doesn’t, I recommend you read the blog post on the regulation of blood sugar first and then come back here to read this part of the blog post again. These are pretty crucial points if you want to understand how the body regulates blood sugar levels, what goes wrong in diabetes, and how we can improve our glucose tolerance.
So, to summarize, if someone is more insulin-sensitive, this provides, in a way, insurance against an increase in insulin resistance in the future. As we will discuss in much detail in future posts, insulin resistance can be the result of an increase in body weight and fat mass, but also due to medications, pregnancies, or acutely result from infections or surgeries.
There are other reasons why it’s better to be insulin sensitive and have low blood insulin levels throughout the day. For example, higher fasting insulin concentrations tend to be associated with an increased risk not just of type 2 diabetes, but also of cardiovascular disease and cancer, in most studies even after adjusting for factors that are typically associated with insulin resistance and hyperinsulinemia, such as age, body mass index and measures of blood sugar control, such as fasting glucose and HbA1c.
And this brings us to the two key questions: who should get tested for insulin resistance, and what kind of test should they get?
Who Should Get Tested For Insulin Resistance?
My personal opinion is that a measurement of insulin resistance should be part of a normal metabolic blood test panel, along with fasting glucose and the serum lipid profile. Because the test is not that expensive, and insulin resistance is associated with an increased risk of several chronic diseases, as we discussed earlier.
Why is it, then, that insulin resistance is not routinely measured? One argument I can see is that the body of evidence we have so far showing that insulin resistance is an independent risk factor for chronic disease is much smaller than for, say, the serum lipid profile or blood pressure. So maybe this is just a matter of time until we have more conclusive data. Another argument I have heard is that insulin resistance is too hard to measure and that this is too expensive and not practical for routine clinical care. Indeed, the gold-standard measurement of insulin resistance is very involved. But, we do have reasonably good surrogate measures that correlate highly with the gold standard measurement, as we’ll discuss later in the blog post, so I think this argument falls flat to some degree.
In my opinion, there is likely another reason why insulin resistance is not routinely measured when we go for a checkup, and that is that doctors wouldn’t usually do anything about insulin resistance unless the patient has manifest diabetes. In contrast to that, we have highly effective medications that are commonly prescribed for hypertension or high LDL-cholesterol concentrations, i.e., for the prevention of chronic disease rather than as a treatment. And while we have medications that improve insulin sensitivity, they are not routinely prescribed for people who don’t have diabetes. So, in a way, insulin resistance is not seen as an actionable risk factor. Yet.
I do think this will change, hopefully in the near future, because there are a lot of things we can do to reverse insulin resistance. And the available data do suggest that reversing insulin resistance may substantially reduce our risk of several chronic diseases.
Now, does this mean that I suggest everyone should get insulin resistance measured every time they have their annual or bi-annual exam? No. There are several well-known risk factors for insulin resistance, as summarized below, and it would make sense to consider these when deciding in whom to measure insulin resistance, and how frequently.

Among the medications that cause insulin resistance are corticosteroids, antiretrovirals, and antipsychotics. If you take any medication regularly, it may be a good idea to discuss with your doctor whether it may induce insulin resistance.
So if you are young and lean and none of these risk factors apply to you, the odds that you suffer from insulin resistance are fairly low, and measuring insulin resistance is not really indicated. For anyone else, though, it does make sense to measure insulin resistance at least occasionally. And let’s be honest, that group makes up more than 50% of the adult population in most countries around the world.
Now, that is my opinion, based on my review of the evidence of the link between insulin resistance and chronic disease risk. Some researchers and healthcare professionals may disagree with this, and my position is, as far as I know, not the official recommendation of any professional medical association. So don’t be upset if your doctor is resistant to measuring whether you are insulin resistant, and know that he or she is probably following the official guidelines. And that means you may need to be prepared to pay for the test yourself.
How Do We Measure If We Are Insulin Resistant?
The gold-standard measurement of insulin sensitivity in people without diabetes is the hyperinsulinemic-euglycemic clamp. A monstrosity of a word, and if you have never heard about that, don’t worry, because I am not going to talk about this. It’s way too involved, and it will never be done in a clinical setting. But it’s relevant because the measure that I am suggesting you could get done is fairly strongly associated with insulin sensitivity, as measured by this hyperinsulinemic-euglycemic clamp.
And that simple measure is called HOMA-IR. HOMA-IR stands for homeostasis model assessment of insulin resistance. HOMA-IR is based only on fasting glucose and fasting insulin. It does have its limitations, but in general, it correlates quite strongly with the gold-standard measurement of insulin sensitivity based on the hyperinsulinemic-euglycemic clamp.
OK, so, how do you practically go about getting HOMA-IR measured?
First, the blood draw and lab measurement. The most tricky thing about getting a HOMA-IR measurement is that you need to convince your doctor to measure fasting glucose and insulin concentrations in your blood. Depending on where you live, you may need to pay the bill yourself, at least for the insulin measurement.
Once the doctor has agreed, you need to pay attention to a few things to make sure the test is done correctly. First, you should go to the doctor for the actual blood draw in the morning, after an overnight fast of at least 12 hours, and you should not have your blood drawn if you have any illness or any indication that you have an immune activation, such as the days after vaccination, an inflammation of your joints, for example, a tooth extraction or some such thing. The reason for this is that inflammation causes insulin resistance. You should also try to not be unusually stressed, so plan your doctor’s office visit well and get there well in advance. Again, the stress response causes insulin resistance. And lastly, be aware of which medications you are taking. As I mentioned earlier, many medications cause insulin resistance. Again, these include corticosteroids, antiretrovirals, and antipsychotics.
Let me say the most important thing again, though, before we move on: you need to get your blood drawn in the fasting state. If you had anything to eat or drink, other than water, in the 12 hours before the blood draw, the test is useless.
Now, to the second step, which is how to calculate HOMA-IR. Here is the formula:

If you have trouble calculating this, you can also search online for HOMA-IR calculators. These allow you to simply enter your lab values, and the calculation is done for you.
Now, how do we interpret our HOMA-IR value?
The calculation of HOMA was calibrated such that a HOMA-IR of 1 is normal, healthy, and perfectly insulin sensitive. But what do we call insulin resistant, then?

Researchers most often use HOMA-IR to divvy people up into two categories: insulin-sensitive below a certain cut-off point, and insulin-resistant above that cut-off point. Different cut-off values have been proposed by different research teams, and the one I have seen most often is 2.5, or something around 2.5, which would mean that anyone with HOMA-IR of less than 2.5 would be considered insulin sensitive, whereas everyone with a HOMA-IR greater than 2.5 would be considered insulin resistant. No matter which cut-off value is used, I personally don’t like this approach, though. I never thought it made much sense that we interpret a HOMA-IR of 2.4 totally differently than a HOMA-IR of 2.6, or that 2.6 would be interpreted the same way as 6.
I, therefore, would suggest we think about HOMA-IR more as a continuous measurement, or at least use it to create several different categories, rather than just two. The figure below shows how I think about this. I’d say that anyone with a HOMA-IR under 1.5 has normal insulin sensitivity, and I have never seen a publication that would disagree with this. Then, between 1.5 and 2.5, that’s where I’d say we have evidence of mild, beginning insulin resistance. And then from there, we gradually get more insulin resistant. HOMA-IR of 7, 8, or higher, should be considered very insulin resistant..

I suggest that the goal should be to keep HOMA-IR at least under 2.5, and, in my opinion, even better, under 1.5. So, in a way, under 2.5, I would call fine, and under 1.5, I’d call excellent or optimal.
There are also more sophisticated tests of insulin sensitivity and resistance, other than this hyperinsulinemic-euglycemic clamp test. You could try to convince your doctor to do an oral glucose tolerance test, have him or her draw blood in regular intervals, such as every 30 minutes, and then measure not just glucose, but also insulin in these blood samples. This type of test is similar to the Kraft test, which some of you may have heard about. This test would give you quite a bit more information, but there are two obstacles to this: first, you will almost never be able to find a doctor who is willing to administer this test for you, particularly if you don’t have diabetes. And second, you would need someone knowledgeable to interpret the data for you. That’s not so straightforward, which means that for most of you, this test would likely not be informative at all, even if you got your doctor to administer it.
So, for these reasons, I suggest you get a HOMA-IR test done if you are interested in whether you are insulin resistant.
Challenge
Now, here’s a challenge for you. Over the next few months, I will publish a lot of content about insulin sensitivity and insulin resistance, and specifically, evidence-based ways to improve insulin sensitivity.
So what I would like to suggest is that if you get a HOMA-IR test done in the next few weeks, and if it’s elevated above 1.5, write it down and post it somewhere you can see it every day. And then, after maybe you have learned a thing or two about how to improve insulin sensitivity and maybe made a few changes to your diet or lifestyle, measure HOMA-IR again and see how much of a difference it made. Maybe 6 months later, maybe 12 months later, give it some time. I am suggesting this because I have found that looking at concrete data can be very motivating, and help reinforce new habits. Particularly for something like insulin resistance, which is not something you would otherwise feel or notice.
References
- Kahn et al.; Quantification of the relationship between insulin sensitivity and beta-cell function in human subjects. Evidence for a hyperbolic function. Diabetes 1993; 42: 1663-72.
- Lillioja et al.; Insulin resistance and insulin secretory dysfunction as precursors of non-insulin-dependent diabetes mellitus. New England Journal of Medicine 1993; 329: 1988-92.
- Weyer et al.; Insulin resistance and insulin secretory dysfunction are independent predictors of worsening of glucose tolerance during each stage of type 2 diabetes development. Diabetes Care 2000; 24: 89-94.
- Xun et al.; Fasting insulin concentrations and incidence of hypertension, stroke, and coronary heart disease: a meta-analysis of prospective cohort studies. American Journal of Clinical Nutrition 2013; 98: 1543-54.
- Reaven. Insulin resistance: the link between obesity and cardiovascular disease. Medical Clinics of North America 2011; 95: 875-92.
- Zhang et al.; Hyperinsulinemia in obesity, inflammation, and cancer. Diabetes & Metabolism Journal 2021; 45: 285-311.
- Kira et al.; Increased cancer mortality among Japanese individuals with hyperinsulinemia. Metabolism Open 2020; 100048.
- Gastaldelli. Measuring and estimating insulin resistance in clinical and research settings. Obesity 2022; 30: 1549-63.
- Matthews et al.; Homeostasis model assessment: insulin resistance and beta-cell function from fasting plasma glucose and insulin concentrations in man. Diabetologia 1985; 28: 412-9.
- Crofts et al.; Identifying hyperinsulinemia in the absence of impaired glucose tolerance: an examination of the Kraft database. Diabetes Research and Clinical Practice 2016; 118: 50-7.
36 Responses
Would you consider C-peptide any useful as a measure for insulin sensitivity?
Yes, for sure. C-peptide is a ‘better’ measure of insulin production by the pancreas than insulin itself because the degradation and excretion of insulin are thought to be more variable. However, to estimate insulin resistance, I prefer a measure that factors in fasting glucose as well. If you look at C-peptide by itself, you also need to consider fasting glucose. If C-peptide is low and fasting glucose is in the normal range, then that suggests good insulin sensitivity. However, if C-peptide is low and fasting glucose is very high, then this suggests beta-cell failure (insufficient insulin production). Very different scenarios. Does that make sense?
Cheers
Mario
Thank you, yes that makes sense. My reason for asking is that the blood panel I get every year does not include insulin for some reason, but I have considered C-peptide in the low end of the range combined with normal HbA1c to be a relatively good sign.
Hi Mario! I am enjoying reading this a lot. Thank you. However, I do disagree with the insulin response of Fred in the Graph showing he has Type 2 diabetes and thus low insulin. In most type 2 diabetics they have a high insulin and C-peptide. It is just they are so insulin resistant this is not enough to manage the blood glucose. It is only in later stage T2DM that you see a lower insulin due to Beta Cell failure.
Hey Penny!
Thanks for your comment.
This graph is based on insulin sensitivity (x-axis) and the acute insulin response to glucose (AIRg) (y-axis), which is really the first-phase insulin response, and that is diminished in people with diabetes quite a bit. That hyperbolic relationship was first described in this paper here:
https://pubmed.ncbi.nlm.nih.gov/8405710/
I can still see what you are saying. For Caucasians and particularly African Americans, higher insulin production capacity would be more typical, even for people with T2DM. Could have drawn him a little higher up on the y-axis for sure. That said, there are also some people with T2DM, particularly among Asian populations, who have very low maximimal beta-cell output, and they develop type 2 diabetes at even lower beta-cell insulin production.
Check out Figure 2 in this paper here: https://pubmed.ncbi.nlm.nih.gov/23704681/
Cheers
Mario
Hi Mario
I work in the diabetes space in Ghana.Your videos and education is of the highest quality.
Really appreciate your work.
Hi Mario,
I sent you an email about this but could you explain why sometimes there’s an improvement in fasting insulin but no changes/improvements in symptoms?? It’s really confusing. When I was first diagnosed with PCOS, my fasting insulin was 12.1 mIU/mL and fasting glucose was 96. NOW, my fasting insulin is 6.3 μU/mL. I learned that these units are the same. My current A1C is 5.2% and fasting glucose is 89.
AND I STILL have all the symptoms of PCOS, insulin resistance, hypoglycemia, and high testosterone so I am really surprised to see the insulin number go down. I feel like my symptoms are worse now with better fasting insulin numbers than before when my numbers were higher. Now, when I eat a carb heavy meal, I get acne almost immediately.
I’d highly appreciate any insights you could share! I’m trying to do everything I can to learn and educate myself on IR to better my health 🙂
I’m currently unable to purchase a CGM because it’s not available in my country.
Hi Uma,
PCOS is a complex disease, and while insulin resistance is a prominent feature, it’s not the main cause of most of the symptoms. My understanding is that the unusually high testosterone production is the key factor, including the factor that causes the insulin resistance. At the same time, PCOS is not my primary area of expertise. Given it’s importance for metabolic health, and how common it is, it may be a good idea to learn more about the condition and make a separate video about it.
Best wishes,
Mario
Hi Mario, thank you so much for your reply. I appreciate it. Yes, given that it is a complex condition and the fact that there’s such a lack of understanding among the medical community and doctors, I think it deserves more awareness and education. So many women with PCOS are dismissed by their doctors and are left scrambling for answers. Interesting you mentioned the high testosterone could be causing the insulin resistance, because I thought it was the opposite. There’s still insufficient evidence but it’s so important to shed light on. I would be so grateful if you did undertake this topic and did a video on it. It’s insane how many women are suffering in silence with this but thanks to social media, we are learning more from educated and informed professionals. Thank you!
Illuminating analysis. Thank You.it is always more complex than the layman thinks.
Ton derksen
Hello Mario,
Really like your videos and presentation…the best I’ve seen on YouTube!
I have a question, if you have time to answer: I tried to calculate the HOMA-IR after watching this video but I’m not sure how, given the way it’s measured on my lab-work results.. My fasting glucose was 5.7 mmol/L and my fasting Insulin was 34 but it’s measured using pmol/L? Can you tell me what my HOMA-IR would be? Thanks, Terri
Sorry I didn’t include that conversion factor. It’s rare these days that a lab reports insulin this way.
For glucose, 5.7 mmol/L is 103 mg/dL
For insulin, 34 pmol/L is 5.7 uU/mL
That results in a HOMA-IR of 1.2.
Cheers
Mario
Thank you so much for taking the time to reply
Looks like my previous attempt didn’t work. What about LP-IR as a measure of insulin resistance? What does it actually measure and how does it compare to HOMA-IR?
Hi Anat,
LP-IR would be another good surrogate measure of insulin resistance. In my opinion, it’s similar to HOMA-IR, but a bit more difficult and more expensive to measure. There are some simpler lipid-based measures of insulin resistance, such as the triglyceride-to-HDL-Chol-ratio or the triglyceride-to-glucose-ratio, that could be similarly used. All of these, including LP-IR, suffer from the fact that we have a lot less data on their relationship to both insulin sensitivity (as measured by the gold-standard clamp) or chronic disease endpoints than for HOMA-IR, so that’s why I suggested using HOMA-IR in the blog post/video.
Cheers
Mario
Hi Mario. Congratulations on your Youtube channel with its clarity and commonsense based science. It is definitely the best out there.
I would love you to post on the following subjects:
1. One meal a day(OMAD) as an intervention strategy.
2. The carnivore diet, also as an intervention strategy.
3. Your recommendations for a necessary toolkit to observe one’s health status.
4. The reliability of body composition scales.
Following Tim Noakes’ example I have turned to a carnivore diet and one meal a day. The results were spectacular and I have lost all the weight I gained when forced to stop running by a knee injury and now have a body fat percentage of 18.4%. My peripheral neuropathy is steadily abating(presumably because the causative factor has been removed) and this in particular delights me. My fasting glucose has dropped to 5.0, which is reassuring. Nevertheless I would like you bring to bear on the above points your trademark scientific clarity.
Keep up the good work.
Peter
Thanks, Peter, for the comment, and congrats on your health journey. I have videos planned for all of your suggested topics for the foreseeable future. Except #4, and there my take is that a bioelectric impedance (BIA) scale is not ideal, but it’s very useful to track changes within one person. That means, even though it may not be the most accurate measure of body fat percentage, if a BIA scale showed a reduction from, say, 25% to 18%, then that certainly reflects an actual reduction.
Cheers
Mario
Hi Mario, thanks for your reply. I have looked at the literature and it bears out what you say about BIA measurements. As you say, what matters for the individual is tracking his own progress and this is where ease of measurement comes into play, which the BIA scale provides. I find it very motivating to track my progress in this way and it is the change that matters, not the accuracy of the absolute value. I am disappointed with the slowness of the reduction in my visceral fat and I am wrestling with the problem of how to speed this up.
Turning to your posts about postprandrial peaks in glucose levels, I have found your advice to exercise immediately after the meal to be most effective. Which brings up another question. I would have thought that it is not the height of the peak that matters the most but the total area of the curve above the baseline value. So, for example, if the peak is only 140 mg/dl but diminishes slowly over several hours, would that not be more harmful than a higher peak that quickly diminishes to the baseline value, in say, less than two hours?
regards,
Peter.
Hi Peter,
We certainly don’t have the data to conclusively answer your question, but the data we do have available make it likely that spikes over 180 mg/dL are harmful because the biomarker of spikes, 1,5-anhydro-glucitol, is associated with several chronic diseases (CVD, CKD, cancer). On the other hand, I do not know of data suggesting negative health consequences of fluctuations within what I consider the normal physiological range (70-140 mg/dL). You can read more about that here:
https://nourishedbyscience.com/2023/05/10/blood-sugar-spikes-qa/
Best,
Mario
Thanks, your earlier article makes things much clearer. Though I do wonder what prolonged exposure to high glucose peaks, say over a period of 30 to 40 years, does to the body. Could the effect be cumulative over a long period of time?
I was searching for a comprehensive and authorative source of information abou glycaemic index and load of a wide range of foods when I came across the Sydney University study – https://glycemicindex.com/
Is this the best source of information?
On their blog https://www.sydney.edu.au/research/research-impact/how-the-glycemic-index-has-changed-the-meaning-of-healthy-food.html
they say the following:
“The study’s other important conclusion was that we can delay or even dodge type 2 diabetes, because such significant weight loss appears to stimulate stem cell production and reboot the beta cells that produce insulin. The body then returns naturally to more effective control of blood glucose (blood sugar) levels.”
referring to the PREVIEW study http://preview.ning.com/
I would love you to comment on this, or even better still, address the subject in a Youtube post.
I suspect my own experience might be evidence of this.
Peter,
This here is the most comprehensive and most current list of GI and GL values of foods:
Atkinson FS, Brand-Miller JC, Foster-Powell K, Buyken AE, and Goletzke J. International tables of glycemic index and glycemic load values in 2021: a systematic review. American Journal of Clinical Nutrition 2021; 114: 1625-32.
This is also the one that my poster and video are based on.
As you read the table, pay attention to the fact that some GI values are based on glucose as the standard, and other are based on white bread as the standard. My values are all based on glucose as the standard (more common).
Best,
Mario
Terrific, thanks. That is what I was looking for.
Please note that the link: https://academic.oup.com/ajcn/article/114/5/1625/6320814
on this page: https://nourishedbyscience.com/the-glycemic-index-and-glycemic-load-of-common-foods/
is no longer valid.
Oh, that’s curious. Thank you for letting me know.
Very informative blog/video series! As the this paper (https://www.ncbi.nlm.nih.gov/pmc/articles/PMC6620259/) makes clear, T2D is actually multiple diseases and while this postexplains a couple of the underlying factors, namely insulin resistances and beta-cell capacity, I believe that the topic of possible disease pathways, how to discover which applies to a specific individual and how that individual might go about managing the progression of their specific form of the disease. For example, I’m recently diagnosed as prediabetic at age 66 with low to normal BMI, physically very active and the only risk factors that I have are age and family history. More specifically, in this post you recommend measuring insulin resistance via HOMA-IR but what about measuring beta-cell function (HOMA2-B)?
Hi Bruce,
Thank you for your excellent comment. You are correct that there are several paths to type 2 diabetes, and a good diabetologist will look into these. For someone with type 2 diabetes and a normal BMI, there are typically two scenarios: one, the person is what we may call ‘skinny fat’, i.e., even though the body weight is normal, the person is undermuscled and has quite a bit of visceral and ectopic fat (I’ll talk about this in the very next video), which would be expected to cause insulin resistance. And even if that’s not the case, there are numerous conditions other than excess body fat mass that cause insulin resistance. So, in other words even if someone has a normal weight, insulin resistance could still be a key problem, and I would not rule that out.
You are correct, though, that often impaired beta-cell function is the key defect in lean people with type 2 diabetes. I’ll talk about that, how to measure it, and how to improve it, in a separate series of videos, but for now I can share that I am not a huge fan of HOMA-B. Early beta-cell secretion defects that are predisposing to diabetes would be expected to show up mostly in the (early) postprandial phase, and may or may not be reflected in the fasting insulin levels that are the basis for HOMA-B. So yes, if you measured HOMA-B in a group of people with diabetes and a group of healthy people, HOMA-B would be consistently lower in the group with diabetes. However, in any one individual who is somewhere in between (such as yourself), I am skeptical that HOMA-B will really provide a lot of insight. I realize that is a problem, because those tests that could provide better information are a lot more involved, but that’s how I see it.
That said, you could determine your HOMA-IR to assess the degree of insulin resistance, and if that’s low, then you could conclude that beta-cell dysfunction is likely the bigger problem.
Note that I am not attempting to diagnose your condition. Just providing you with some general thoughts to discuss further with a healthcare provider.
Best,
Mario
Thanks Mario for you detailed response.
Thanks Mario for your excellent video and blog. Like Bruce I have been recently diagnosed prediabetic with impaired fasting glucose at the age of 62. I have a BMI of 23, very active (VO2max about 50) and have made some dietary interventions (low gi food, no processed food, reduced alcohol, no snacking) about 9 months ago. My doctor willingly measured my fasting insulin and c-peptide along with my fasting glucose. I used the HOMA2 calculator (https://www2.dtu.ox.ac.uk/homacalculator/) and here are the results (note the HOMA2 calculator allows you to select between insulin or c-peptide for the calculation):
Glucose = 5.3 mmol/L (95 mg/dl), Insulin = 3.2 mU/L (or uU/ml), HOMA2-%B = 46.9%, HOMA2-IR = 0.4
Glucose = 5.3 mmol/L (95 mg/dl), C-peptide = 0.4 nmol/L, HOMA2-%B = 77.8%, HOMA2-IR = 0.9
Apparently the fasting insulin measurement can be quite inaccuate compared to C-peptide measurement (https://medlineplus.gov/lab-tests/c-peptide-test/#:~:text=During%20the%20process%20of%20making,it's%20easier%20to%20measure%20accurately).
The HOMA2 C-peptide results seem more believable in my case. It seems likely that my problem is also beta-cell dysfunction.
One of my concerns is I don’t know how long I have had impaired fasting glucose for. From my annual blood tests, it appears that it may have started more than 12 years ago. I have read that some beta-cell dysfunction may be reversed after intervention, but for cases like this is there any evidence that any reversal is possible after such a long time?
Any comment appreciated.
Hi Ian,
Thank you for sharing. You seem to have a pretty good idea about what’s going on. It’s pretty clear that insulin resistance is not your problem.
As to reversing beta-cell dysfunction, it depends on what the cause is:
– If someone follows a low-carb diet, then beta-cell function (specifically the first-phase insulin response) can be impaired. From your description of your diet, it doesn’t sound like that applies to you!?
– If someone has beta-cell function and has overweight or obesity, then it is possible that the reduced insulin-secretory capacity is caused by fat accumulation in the pancreas (yes, another type of ectopic fat!). In that context, loss of excess body weight has been shown to reduce the amount of ectopic fat stored in the pancreas, which is associated with an increase in beta-cell function. I’d guess this also is not a likely factor in your case, because one type of ectopic fat (pancreas) is usually associated with other types of ectopic fat (liver, muscle), and therefore with insulin resistance.
– The third option is simply genetically reduced beta-cell function. Maybe you want to think through your first- and second-degree relatives whether you have a clustering of people with diabetes or prediabetes among them?
Obviously, this is not medical advice or a diagnosis. These are simple suggestions based on the science of beta-cell dysfunction for you to think through and discuss with your doctor.
Best wishes,
Mario
I first became aware of the link between impaired carbs metabolism and atherosclerosis or CVD only this year. After that I measured my HOMA IR and found to by 2.5. I started a 3 months period of intermittent fasting and low carb diet and it dropped to 1.4. Then I’ve dropped the IF as I found it difficult. I sticker though to the low carb diet ( around 150 g/daily). After 2 months my HOMA IR raised again to 2.1. As I cannot reduce my carbs intake more, here I am to learn more on the subject.
Dr Kratz thank you for the efforts you make!
Hi Dr. Kratz,
Thank you for taking the time to provide such detailed yet easy to digest information on such important topics.
Like a commenter above I’m very insulin sensitive, based on HOMA-IR and LP-IR scores (<1 and <25, respectively), yet my blood glucose regularly spikes to 160-170 after each meal. I’ve taken your advice to avoid naked carbs, go on walks, add vinegar, etc. But it seems like I’m just not genetically blessed to produce much insulin (my fasting insulin has been as low as 0.7 uIU/mL and C-peptide of 0.68 ng/mL). I’m very fit with low body fat and I do resistant training and cardio regularly. I also don’t have a family history of diabetes. So I’m curious if there are any ways for someone like me to boost beta cell function or is it entirely determined by genetics?
Thanks again for all you do!
Hi Josh,
It’s really hard to know what is going on. I hear from a lot of people like yourself recently who seem to have great insulin sensitivity, yet moderate glucose intolerance or blood glucose spikes. It is possible that a slightly reduced first-phase insulin response (the first part of insulin secretion) is the cause of blood sugar spikes in such individuals, but it’s also important not to jump to conclusions too quickly.
For example, a blood sugar spike could be the result of being acutely stressed. If you notice that you are rushing from meeting to meeting and eat on the go, and those are the meals that give you a higher blood sugar level, then maybe this is partly related to acute stress. It could also be that you have accelerated gastric emptying (the food leaves the stomach quickly after eating), which has also been linked to blood sugar spikes. Or maybe what you are experiencing with unexpectedly higher blood sugar levels could be related to the second meal effect? Do you often consume low-carb meals followed by high-carb meals? The low-carb meals could impair your first-phase insulin response in response to the subsequent high-carb meals. And lastly, please note that I suggest >180 mg/dL as a threshold for a spike; see linked blog post below. Do not believe the hype on social media that any increase in blood sugar by 30 mg/dL is a spike; there is no evidence at all supporting that.
Some resources for you to learn more about all of this are in this video, where I explain my rationale for how I define a blood sugar spike, and what the relevance of the first-phase insulin response is and how it’s linked to carb, protein, and fiber consumption at prior meals:
https://nourishedbyscience.com/blood-sugar-spikes-qa/
Cheers
Mario
Confused with my results….
Context.
4-8-25 BS = 301
Total Chol = 316, HDL=59, Trig=167, LDL=224, NON-HDL=257
Started exercising 80 mins mod to intense 4-5 a week (cycling)
Change diet to much lower carb intake (100g roughly) and more vegs.
Run a calorie deficit of around 500 Cals
4-30-25 BS = 230
4-30-25 A1c = 11.1
Next four weeks Metformin 2x daily 500mg
Next four weeks Mounjaro 2.5mg starter dose
5-7-25 start using a a CGM
5-27-25 BS = 84
5-27-25 A1c=9.7
Total Chol =256, HDL=66, Trig=104, LDL=167, NON-HDL=190
5-27-25 INSULIN, INTACT, LC/MS/MS = 7
5-27-25 C-PEPTIDE, LC/MS/MS = 1.59
Quest the blood test vendor shows a INSULIN RESISTANCE SCORE of 21 (Insulin Sensitive 66 )
CGM is estimating my A1C at 5.7 and I am running around a 100mg/dL average BS over 3 weeks
Weight loss of 22 Lbs (228 to 206) puts me still at a BMI of 27 so getting close to 25…
HOMA IR calculated score is 1.5 which is good.
IF I do a C-Peptide to Glucose Ratio I get 1.9 which is listed as Deficit (Endogenous insulin secretory capacity)
So Dr. appointment on 5-28 (Second visit) with this Dr. and the first time on 4-30 all I got was you need to be a vegan and a rant about some guy running a marathon that died of a heart attack and the moral is you can’t run your way out of Diabetes.
During the second visit he asks what I think of my blood work I say pretty large drops for 4 weeks. I think I would like to come off med and try this with just Lifestyle and diet changes. HE tells me that’s Crazy and that he is the one with a dr degree and that T2D is treated with medication. Explains again that I need to be a Vegan and that “WE” have known for a long time that diabetes is caused by fat “surrounding the cells to be specific” Needless to say I am looking for a new DR but until I do I am stuck with him.
So I did personally decided to come off Met and Mounjaro and see. for the last week my numbers have been worse. Which is to be expected. Context from my research tho was Met is only good for 1-2 points lower A1c during studies that lasted a yr and with twice or more then I was taking and that Mounjaro starter does not have much of any effect during the starter dose.(per there literature)
When I say worse I am starting to baseline at 100-120 and never getting below even after 12+ hours of fasting(overnight). Spiking higher NOT extremely higher but a shrimp and veg meal I was getting 140 max and now its 180. This is a meal with little to no carbs.
Enough context back to main topic. HOW much weight do I put into these GOOD #s like HOMA IR when they were under drugs?
Do I read into the C-Peptide to Glucose Ratio reading that my issue is really Beta Cell side?
Should I stay off meds for 4 weeks and request new blood work? Go back on meds and continue my Lifestyle and diet changes and revisit being off meds down the road
I know you can’t give Medical Advice. I guess I am just looking for another set of eyes and more context from someone with more experience then me. Because my dr. I think got a 5 gallon bucket 25 years ago and labeled it Diabetes and puts EVERYONE in it and starts meds and Vegan RANT..
Thanks in advance for your time and insight.
Doug
PS I do have more test results then the ones listed…. ALT was out of wack 65 then 49. But if there are other results you feel might be helpful let me know. Also had CT Scan on stomach for another variable. and of course… Fatty Liver
Hi Doug,
Calculating your insulin sensitivity and beta-cell function, as I explain in this video here, may be useful:
https://youtu.be/gdqp-j9bxMI?si=x9zIwUIOTbZLIhKx
Aside from that, of course medications affect these measurements, so that needs to be considered in the interpretation. Specifically, metformin increases insulin sensitivity and mounjaro increases both insulin release and reduces glucagon production. The best approach would be to wait until all of your blood sugar metrics, such as fasting glucose and HbA1c, are in the normal range, and then – in consultation with your doctor – experiment with coming of the drugs (one by one) to first see whether you can maintain normal glucose values without them. Then, if you do, you could measure fasting glucose and insulin to get a sense of your ‘real’ insulin sensitivity and beta-cell function. It would not be a good idea to go off meds if your fasting glucose and/or HbA1c are elevated, because doing so would raise your blood glucose further.
Best wishes,
Mario
Hi Mario, I took a fasting insulin blood test the other day from Quest Diagnostic in Florida and received my results shortly after; however, I can’t figure out what test result number to use to calculate my HOMA-IR. Which one should I use? 1)Insulin, Intact, LC/MS/MS, whichis 9; or 2)Insulin Resistance Score, which is 24.
Hi William,
Normally, you just take fasting insulin in uU/mL (sometimes also uIU/mL). If your lab reported the data in pmol/L, you’ll need to convert that to uU/mL. Just google “insulin conversion” and you’ll find an online conversion calculator from one unit to the next.
Cheers
Mario